23 Operations Analytics And Forecasts
Operations analytics and forecasts
Who this is for: managers and office staff who review delivery, capacity, collections and parts.
What you will learn: how to read the operations report and the limits of each forecast.
Open the report
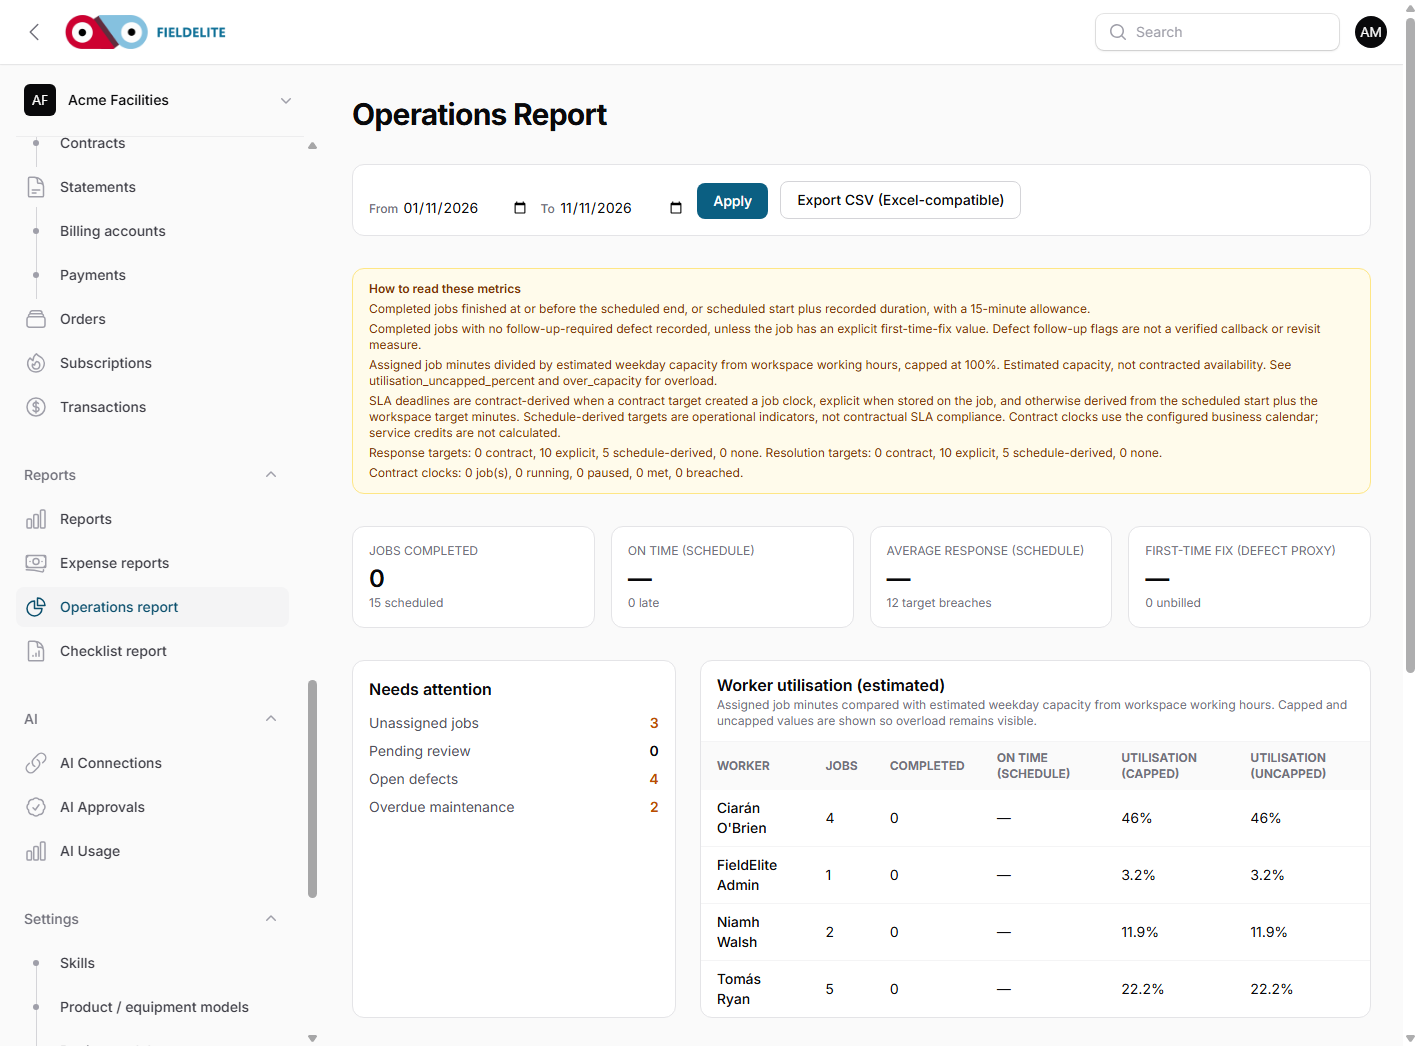
Open Reports → Operations report, choose the date range and select Apply. The CSV button exports the worker-utilisation table.
Delivery metrics
The report covers scheduled/completed jobs, on-time completion, response time, repeat-visit first-time fix, contractual SLA outcomes, PPM outcomes, recorded and billable time, known travel miles and data-quality unknowns.
Jobs without a clock, travel distance or completion time are reported as unknowns, not as success or zero.
Utilisation
Assigned job minutes are compared with estimated weekday capacity. Recorded unavailable periods reduce capacity. Capped and uncapped values are shown so overload remains visible.
The capacity estimate is not contracted availability.
Four-week forecast
| Forecast | Basis | Limitation |
|---|---|---|
| Jobs | trailing completed-job average | backward-looking |
| Revenue | trailing issued-invoice average | no pipeline prediction |
| Capacity | current available workers × working hours | current availability |
| Utilisation | booked minutes ÷ capacity | a booking is not a guarantee |
| SLA risk | running clocks due in seven days | no penalty calculation |
| Collections | historical cash rate applied to open balances | not a payment guarantee |
| Parts demand | trailing consumption projected four weeks | no seasonality or failures |
Collection proxy
Invoices due in the previous 12 months and at least 60 days old provide the rate. Customers with three or more historical invoices get a customer-specific rate; otherwise the global rate is used. Open balances are bucketed into not due, 1–30, 31–60, 61–90, 90+ and unknown due date.
If there is no usable history, expected collections are unknown, not the full balance.
Parts proxy
The forecast uses consume and van-consume movements from the last eight weeks. It shows consumed quantity, observed weeks, average weekly quantity, projected four-week quantity, available stock, reorder level and projected shortfall.
A shortfall is a prompt to check purchasing, not an automatic order.
Related: Reports and map · Quotes, invoices and payments
Related articles
Who this is for: everyone in the office workspace. What you will learn: where the help centre lives, how to search it, and how to get from a screen to the right article. Open the h...
Who this is for: office administrators, dispatchers, managers and finance users. What you will learn: how to sign in to the right workspace, find your way around, and set up your p...
Who this is for: office administrators, dispatchers and managers. What you will learn: how FieldElite models a customer, its sites and the people on site — and how to give a custom...
Who this is for: office administrators, dispatchers, managers and supervisors. What you will learn: how to raise a job, assign it, move it through the status workflow, and close it...