Which contracts to bid, which to exit: the cost-to-serve question FM boards keep answering by feel
Portfolio margin hidden by averages: how job-level time, travel, parts and subcontractor spend turn cost-to-serve into a board decision instead of a feeling.
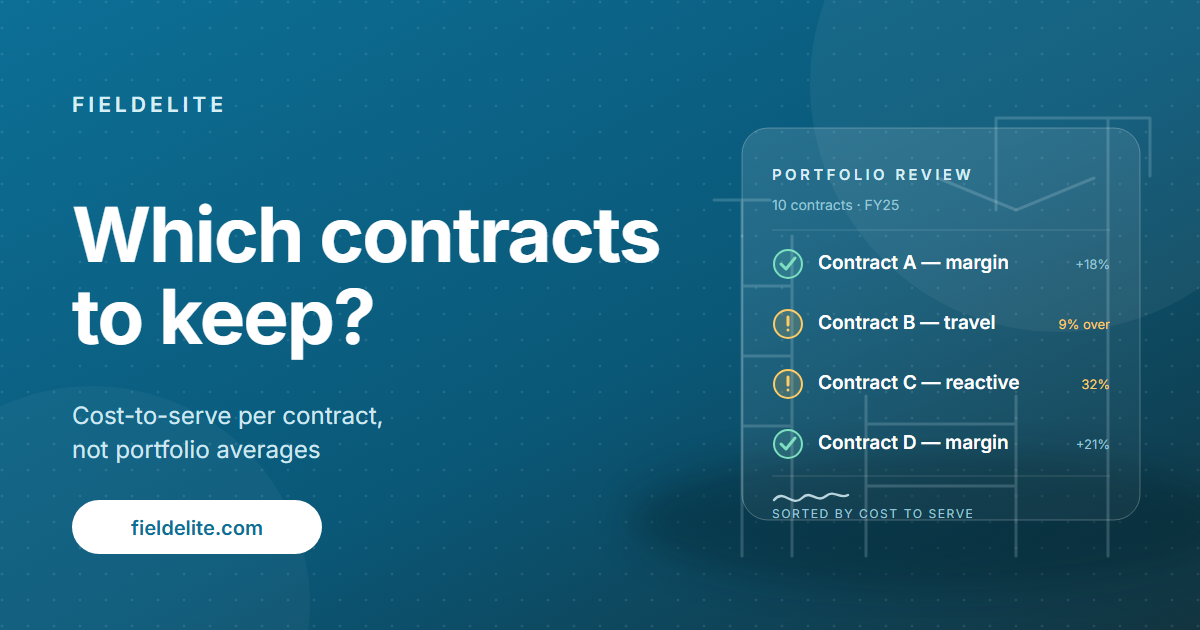
At portfolio review, FM boards ask a question that sounds simple: which contracts make us money? What comes back is almost always revenue-plus-gut: big contracts feel important, familiar contracts feel profitable, and the loss-making ones hide in the middle of the averages.
Why the real answer is hidden
A contract's apparent margin is tender price minus invoiced cost. But true cost-to-serve includes what the averages absorb: disproportionate management time, travel-heavy job patterns, unprofitable reactive callouts that never get billed out properly, asset-heavy sites consuming spare parts, and the client whose demands quietly exceed the schedule. None of that shows at contract level until job-level data, travel time, parts, subcontractor spend, engineer hours, is structured and attributable.
What cost-to-serve visibility changes
- Portfolio decisions become defensible. "This contract costs 9% more to serve than its nearest comparable, driven by travel and reactive ratio" is a board conversation. "We feel this one's messy" is not.
- Remediation precedes exit. Most underperforming contracts can be fixed — restructure the schedule, adjust rates at variation, re-scope the asset base — if the specific leak is visible before the renewal window closes.
- Bidding gets selective. The pattern of what makes a contract profitable for you (site density, asset mix, reactive ratios) becomes the profile you price keenly and the rest gets declined or risked honestly.
- Renewals get argued from data. The client sees the same cost-to-serve evidence you do, and the commercial conversation becomes collaborative rather than adversarial.
The precondition is unglamorous: one job record connecting time, travel, parts and invoice, per contract, trended. Once that exists, strategy stops being an annual instinct and becomes a quarterly discipline.
Where to start
Pick ten contracts, build the cost-to-serve view, and let the outliers make the case for the rest of the portfolio. It rarely takes more than one board meeting before the exercise goes estate-wide. The reporting guide covers the job and contract reporting the view is built from.
Denizon builds the job-record and analytics layer that turns contract portfolios into decisions. Talk to us about a cost-to-serve pilot.
Related: Reports · Operations analytics and forecasts · Reports, map and billing review · About FieldElite and Denizon

Nora writes about the operational and commercial questions behind service delivery: cost-to-serve, energy performance, footfall and transport planning.